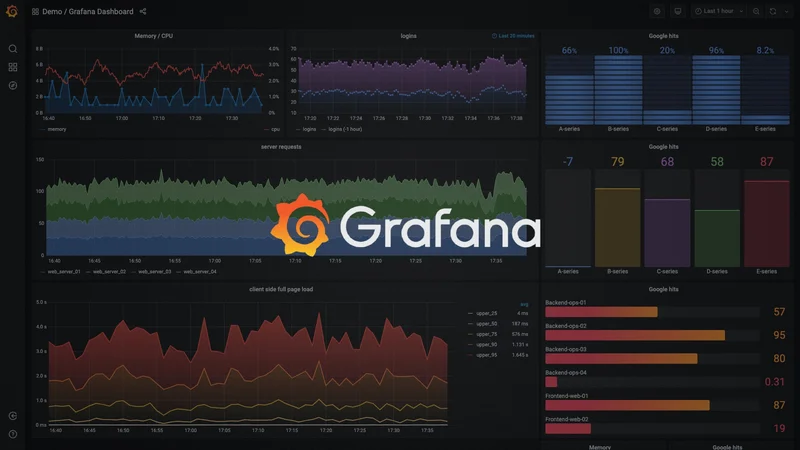
Grafana is an open-source platform for monitoring and visualizing metrics, logs, and traces from multiple data sources.
echo
Tech Stack
OpenTelemetryCrowdinPlaywrightGoogleGoogle AnalyticsPrometheusGitHubNode.jsJavaScriptDockerGoNginxTraefikGrafanaMySQLPostgreSQLReactReact RouterTypeScriptWebpackJSXCSSTesting LibraryRollupOpenAPIZodEsbuildESLintJestD3.jsBabelStorybookPrettierSWCMonaco EditorCypressCINXValenvmYarnBashDependabotRenovateGitHub ActionsPythonRuby
Summary
Grafana is an open-source platform designed for monitoring and observability, enabling users to query, visualize, and alert on their metrics regardless of where they are stored.
Key features:
- Visualizations - Fast and flexible client-side graphs with various options and panel plugins for different visualization methods.
- Dynamic Dashboards - Create reusable dashboards with template variables that allow for dropdown selections.
- Explore Metrics - Conduct ad-hoc queries and dynamic drilldowns to analyze data effectively.
- Explore Logs - Seamlessly switch from metrics to logs while preserving label filters for quick searches.
- Alerting - Define alert rules visually for critical metrics, with notifications sent to platforms like Slack and PagerDuty.
- Mixed Data Sources - Combine various data sources in a single graph, allowing for custom queries.
Grafana fosters a data-driven culture by enabling teams to create, explore, and share dashboards, making it a valuable tool for organizations focused on data analytics.
Comments
No comments yet. Sign in to add the first comment!